
Our radar-based glacier monitoring at Weissmies is operational since more than one month. Several ice avalanches happened during this time. We managed to capture one of them in unprecedented detail:
Two days before the failure, locally increased velocities were measured with the interferometric radar- Our webcam captured a movie of the avalanche
- After the avalanche, we could trace the avalanche path in the radar data
These results show that it is possible to predict even small ice avalanches (with a volume of about 1’000 m²) by radar interferometry.
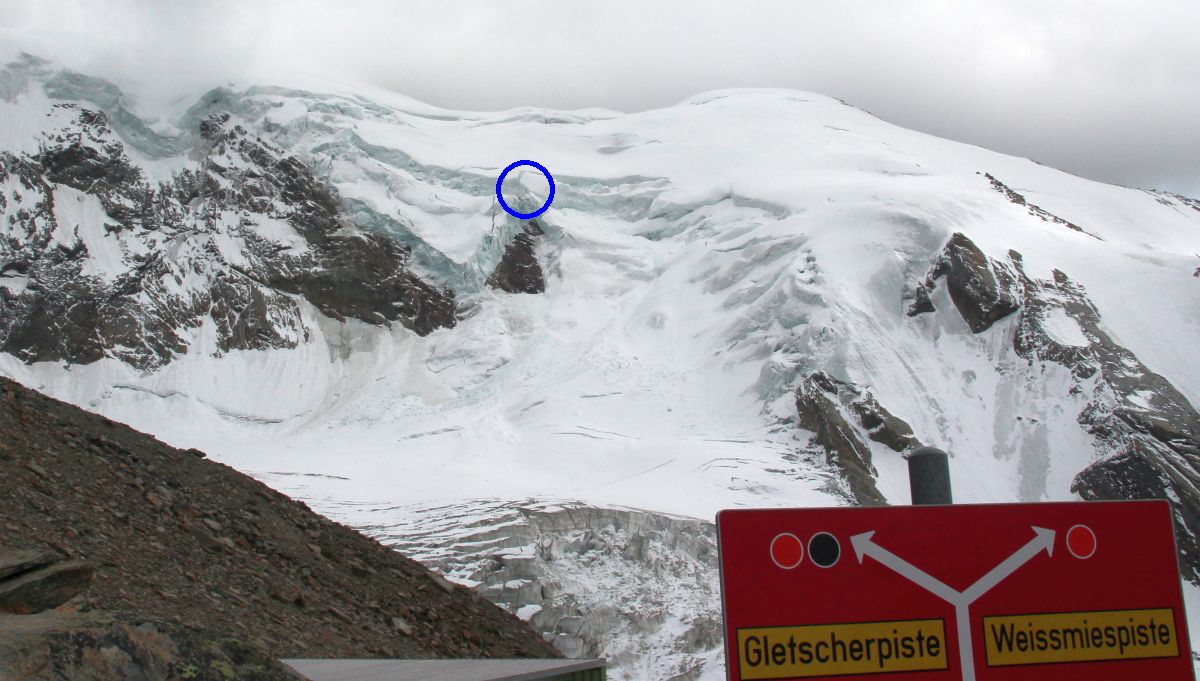
View from the radar position to the Trift glacier in the Weissmies north face. The area where locally increased velocities were measured is indicated by the blue circle.
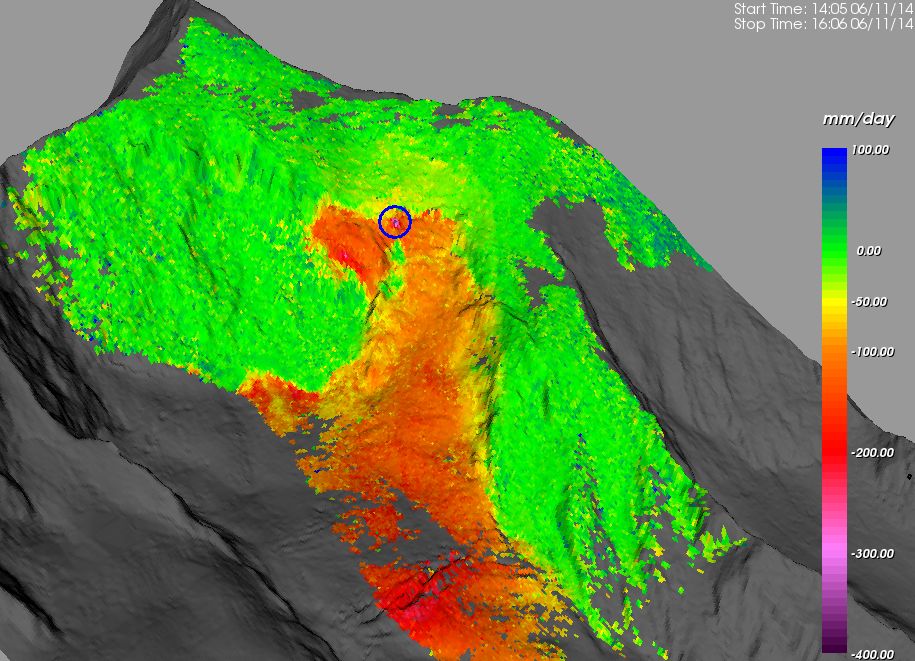
Radar measurements from Nov 6. The glacier is moving at around 10-15 cm per day. Just on a few pixels (blue circle), the velocities are higher, approx. 25-35 cm per day.
Looking at this region in more detail, we see that a few pixels inside the blue circle (200-300 m²) showed by a factor of 2-3 higher speeds than the surroundings. The velocity is increasing constantly during the two days.
The failure happened on Nov. 8 at 12:54 and was filmed by our webcam. It triggered a snow avalanche.
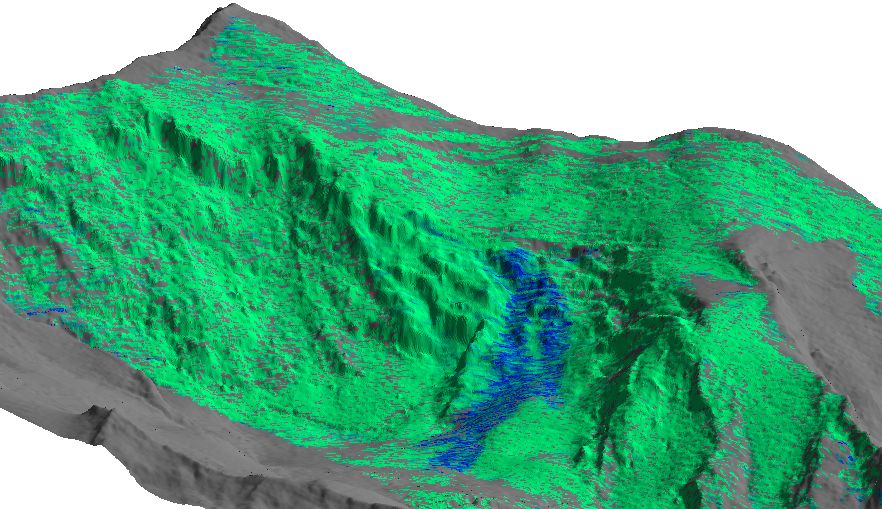
How far did the resulting snow avalanche go? The avalanche path was reconstructed by comparing the surface right before and right after the avalanche. The interferometric radar detects surface changes within minutes. Green areas indicate an unchanged surface. On the blue areas, the avalanche has altered the snow surface.
Recent Comments