Correct prediction of glacier collapse with radar measurements

Oct 1, 2017Neuigkeiten

The Trift glacier above tourist village Saas Grund in the Swiss alps collapsed in the early morning of 10 September 2017 (Sky News, CTV News, Independent). Approximately 200,000 m³ of ice broke off the glacier in multiple events without causing any damage in the valley below. The Trift glacier had been monitored by Geopraevent with georadar and camera since 2014. Increasing accelerations of the observed glacier area were detected over several days by the interferometric georadar and subsequent flow rate analysis enabled experts to estimate the approximate date and time of the collapse within 24 hours.

Earlier this year, the radar was removed from this monitoring location. After 2.5 years of continuous radar operation, the instrument was replaced by an HD-camera for deformation monitoring by image analysis in spring 2017. A few months later, the deformation analyses showed a distinct acceleration of the unstable glacier area under surveillance. Whereas the HD-camera is a convenient and cost-effective method for long-term monitoring, its deformation analysis is not precise enough for the assessment of urgent hazards (see a comparison of the two technologies here). Additionally, the weather turned bad when the flow rate increased sharply and visual image analysis was impossible.

Video1: Time lapse of deformation analysis retrieved by HD-camera from 10 August to 9 September 2017 with the unstable glacier area  in the red rectangle. The images clearly show the acceleration of the ice masses (cyan colour). Data gaps emerged during bad weather periods (e.g. from 1 to 4 September 2017).  

Radar provides reliable data at any time

Hence, we reinstalled the interferometric georadar on 7 September 2017. A few hours afterwards, it was already fully operational and measured the initial flow rate of 80 cm/day. Two days later, on 9 September, this value had duplicated and it became obvious the glacier collapse was imminent. Velocity analysis and the assessments of glacier expert Prof. Martin Funk of VAW/ETH Zurich indicated the most likely time of collapse would be the following morning (10 September 2017).

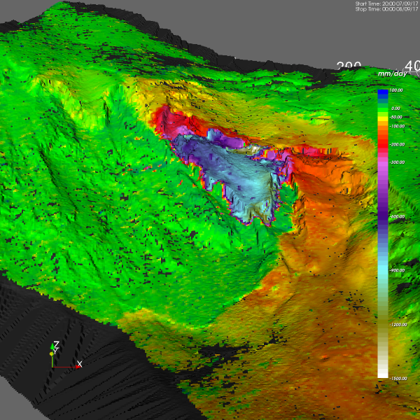
Figure 1: Radar image of 8 September 2017, midnight: The flow rate reached 80 cm/day. 

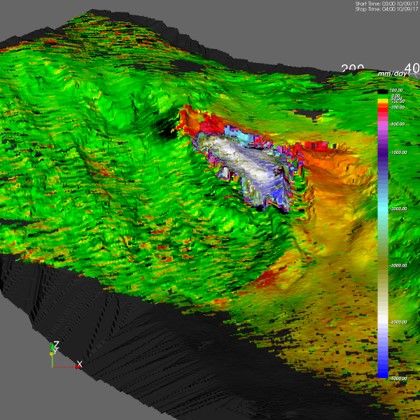
Figure 2: Radar image of 10 September 2017, 4 AM: The flow rate increased to 3.6 m/day shortly before the collapse. 

At this stage, it was still unclear whether the unstable glacier part would collapse at once or in several events. In case of a singular event, it was assumed that the collapse could form an ice avalanche powerful enough to reach the village. Therefore, preventative measures were taken in the village Saas Grund at the foot of the mountain and the part of the villlage at risk was evacuated in the afternoon of 8 September. The unstable glacier area continued the acceleration during that night and eventually exceeded 3 m/day early in the morning. Between 05.30 AM and 06.00 AM, a large part of the instability collapsed and remained on the glacier below. Shortly afterwards, the all-clear was given and the residents returned to their homes.
Video2: Before-After-Image of the collapse area of Trift glacier (9 September vs 10 September 2017). 
Find a comparison of the two technologies for deformation analysis (HD-camera vs radar) here.
More about the Weissmies project here.