GRAVX™ online data portal
Do you want to know what is going on in your natural hazard zone at all times? Our stations measure gravitational natural hazards worldwide and upload the data to our servers for further processing. GRAVX online data portal connects, visualises and archives measurement and status data and provides you with the relevant information up-to-date and conveniently via your preferred devices, i.e. smartphone, tablet or PC. GRAVX online data portal is based on state-of-the-art technology and offers secure storage of your measurement data with password-protected user access.
Learn more:
⇒ benefits
⇒ user interface
⇒ selected features
⇒ applied technologies
⇒ demo account

Benefits
- Easy navigation on the portal
- Overview of different stations and measurement data
- Display of events on a map with images and videos
- Event list with filter functionality
- Interactive graphics of measurement and status data with export function
- Image viewer with comparison function for easy inspection of details (e.g. cracks, crevasses, avalanche release zones)
- Access to past events
- Control center for remote control of cameras, gates and traffic lights
- Station-specific communication tool with technical change log
- Access via all devices (smartphone, tablet, PC) with password-protected user access
- Calculations of additional data series, e.g. totals (precipitation), differences, smoothing or other customised functions
- Integration, display and monitoring of third-party data
- Available in 6 languages: German, English, French, Italian, Spanish, Norwegian
- Secure data storage according to international standards
- Application loads fast and runs stably despite large data volumes
Simple user interface
GRAVX online data portal is designed for easy navigation with maximised space to display the relevant information on all devices (smartphone, tablet or PC). The navigation bar with the various functions and views is now located on the left-hand side and can be flipped in to gain even more space for data display.
After login, you will get directly to the start window of your station, or in case of several stations, to the first station in the list. When using a smartphone, the maximised view is automatically displayed. Click the icon ![]() next to GRAVX to change the station or swap the view. Click the arrow icon
next to GRAVX to change the station or swap the view. Click the arrow icon ![]() to return to the maximised view or automatically get there (smartphone).
to return to the maximised view or automatically get there (smartphone).
The top section contains station information, including station notfications for easy communication between project partners, as well as changes made by Geopraevent and the recipient list for SMS and email notifications. Other views, such as dashboards with various graphics, image viewers for events and status images, measurement series, event maps, control centres for remote control of alerting devices and current status of all system devices or remote control interface for cameras are displayed in the area below.
Do you need technical support? Click on the support icon in the top right corner and contact us by phone or email. We will get back to you as soon as possible.
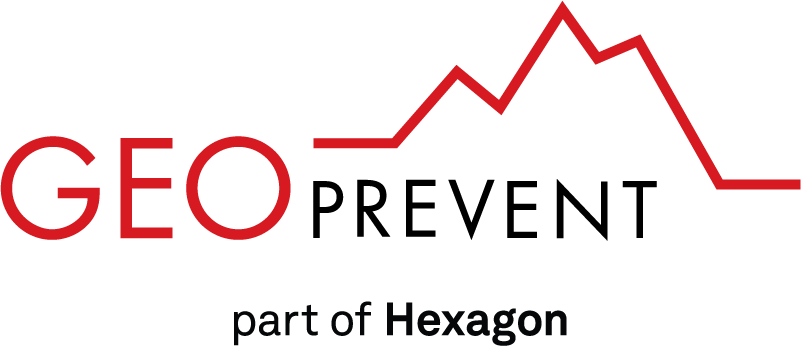
Event map view with event display, associated camera images and videos, event parameters and list of all events.
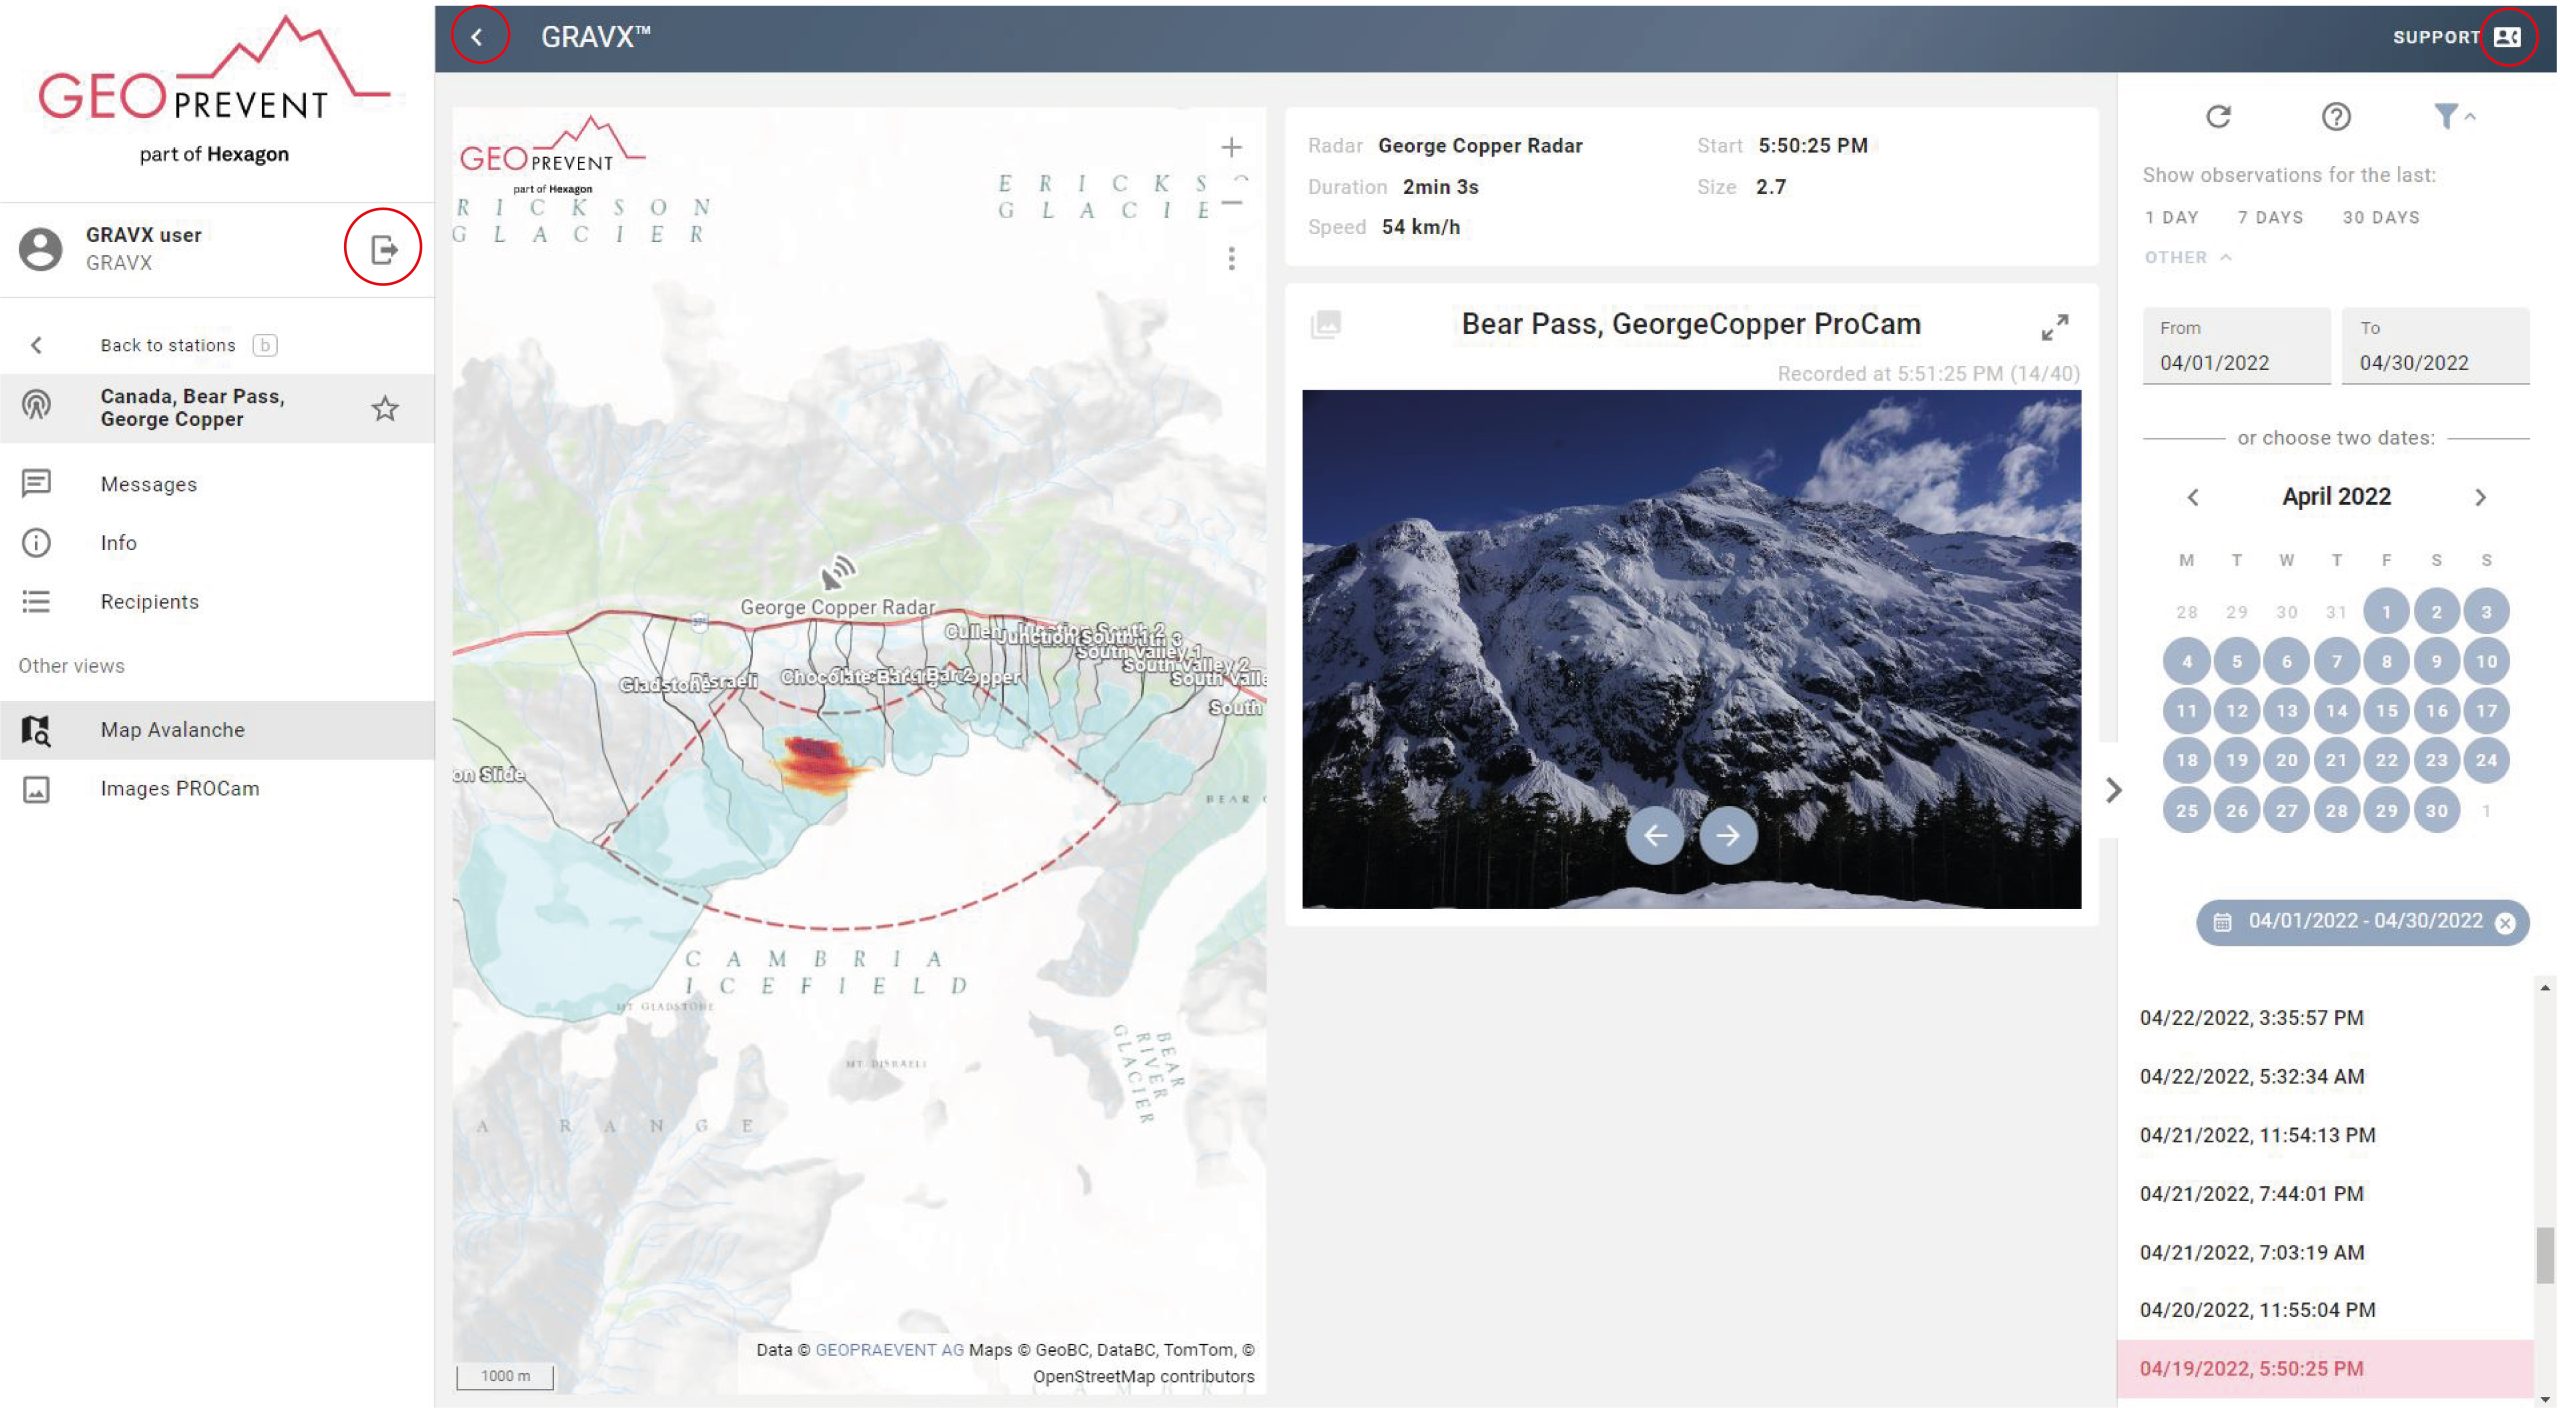
Display of a debris flow alarm system measurement series with various functions in the navigation bar on the left side.
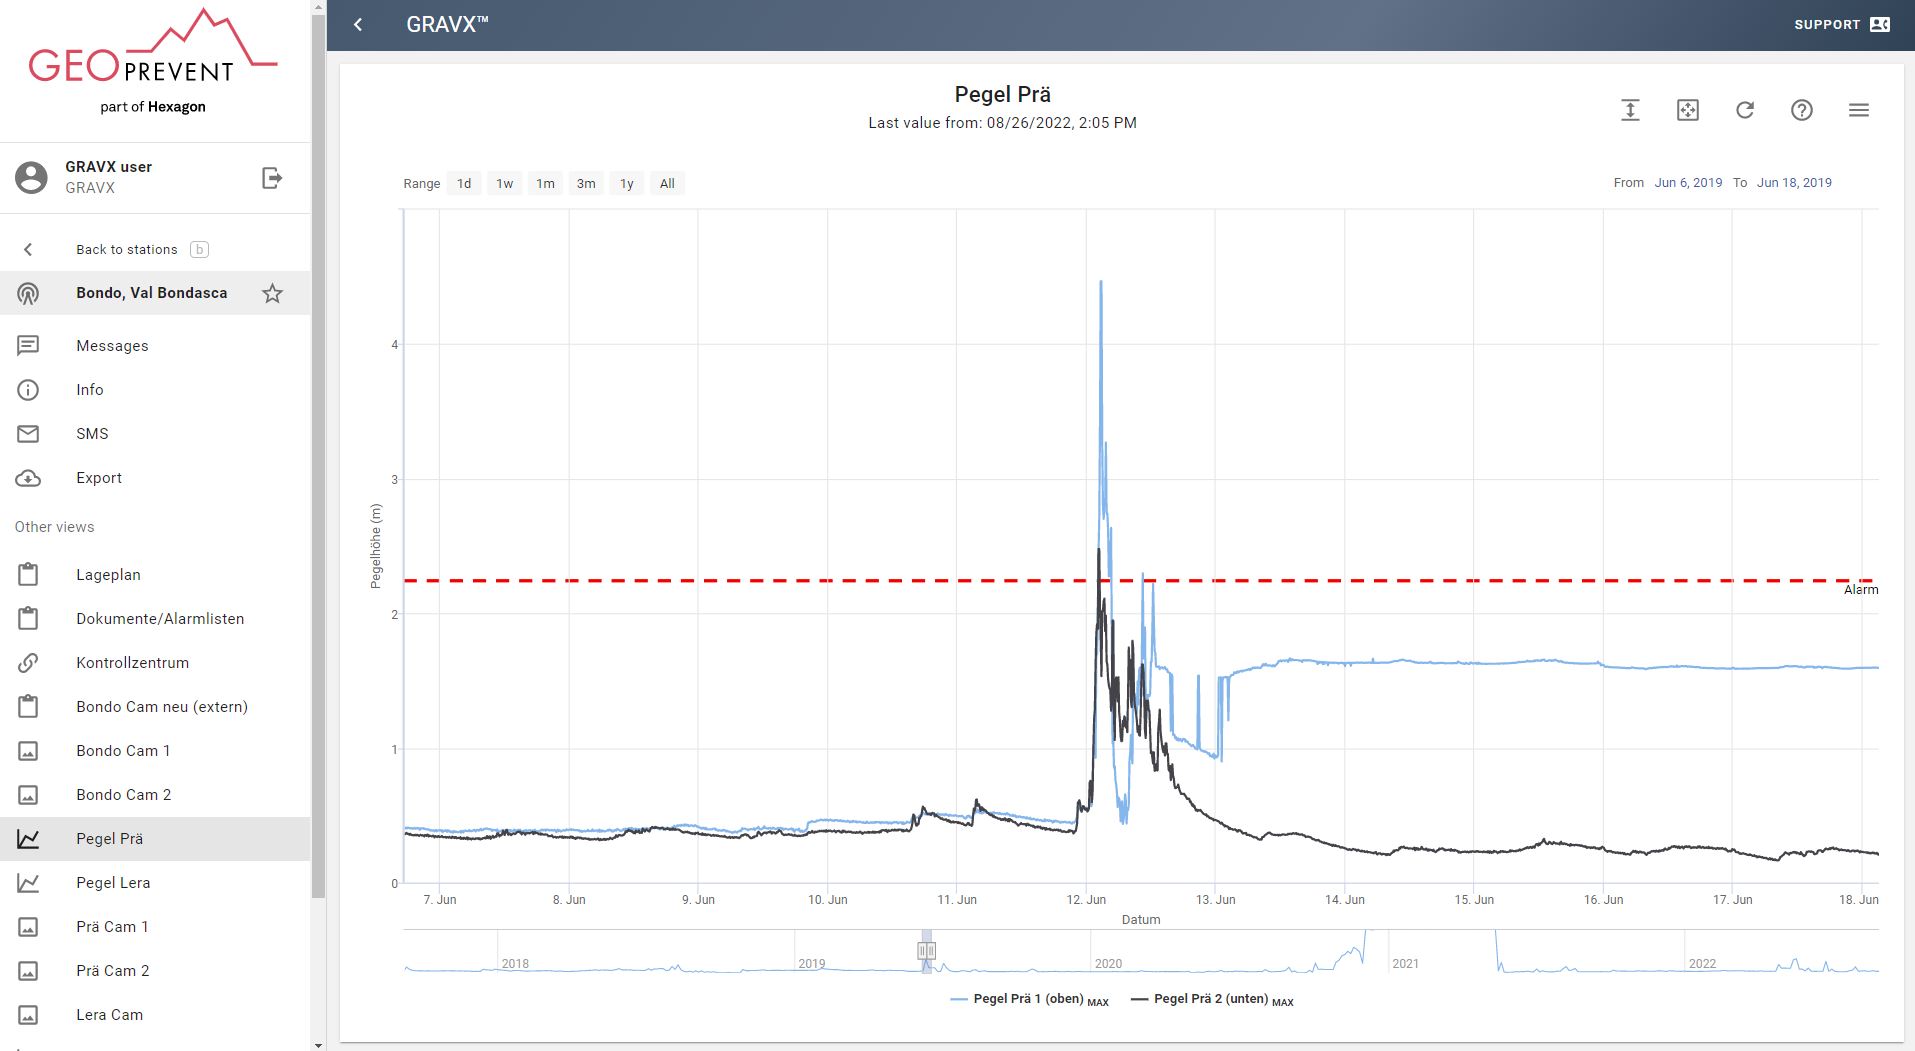
Event map view on the cell phone. Event details are displayed below the map.
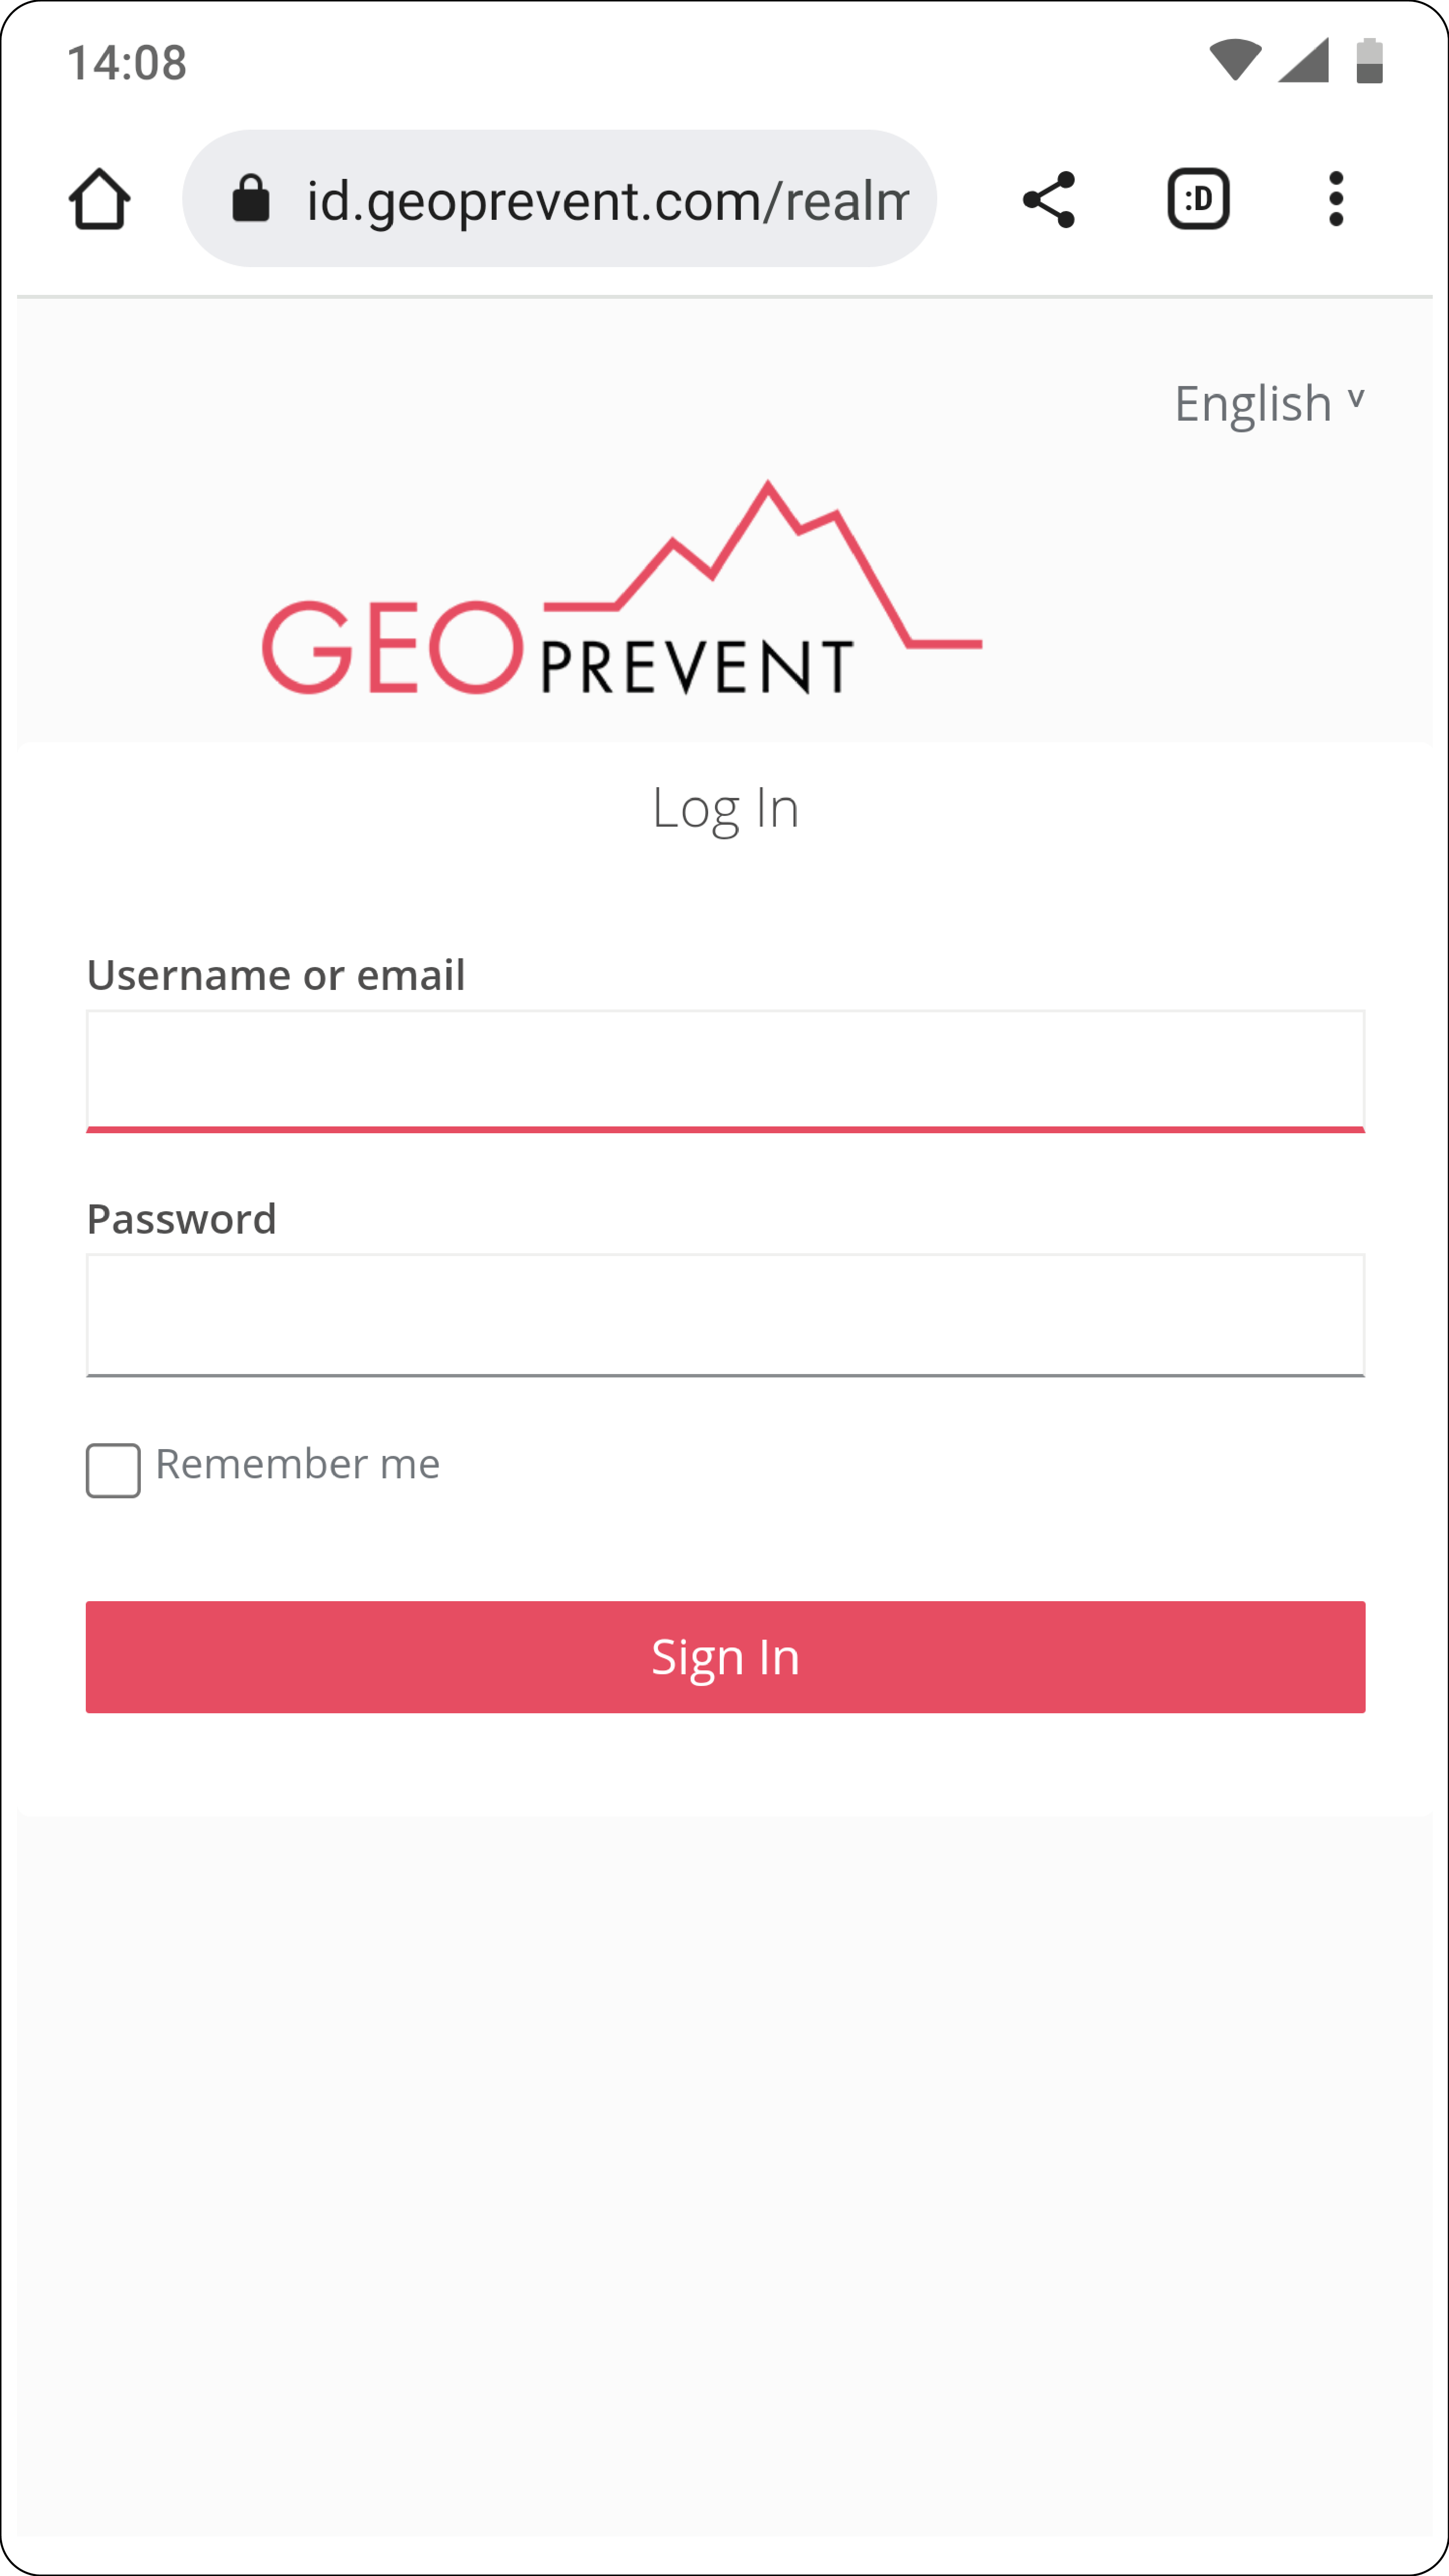
Login page on the cell phone. Login data can be saved for easy access.
Image viewer
Images and videos from PTZ, high-resolution or thermal imaging cameras are displayed in our dedicated image viewer. This viewer allows you to filter images by time or event type. Select a time duration and whether you want to see status, event or manually triggered images and show only the relevant images for you.
The image viewer also allows you to view an image in detail and compare with a different image. Zoom into the picture using the mouse wheel or the fingers on the smartphone and select another picture from the list. The selected image section remains the same and changes can be easily identified. Switch between images using the arrows (up and down) or tap them with the mouse. You want to compare specific images? No problem, mark them by holding down the Ctrl key and switch back and forth between the images with the arrow keys. Often it is useful to compare images with a similar exposure. To do so, select a suitable duration in the filter, as shown in the example below.

Click on the cross next to the selected time period to reset the filters.
To view the image in full size, click on this icon ![]() on the right and the image will be displayed in a new window.
on the right and the image will be displayed in a new window.
Event map
The event map displays avalanche or rockfall events in an online map with the corresponding pictures and videos. Select the event from the list on the right-hand side (on the smartphone, the list is at the bottom of the screen). The list is empty if there are no events in the selected period. Click on the filter icon to select a different time period. You can choose between 1 day, 7 days or 30 days, or you can select any time period under “other”. Click on the first and last day of the desired time window and close the filter again using the filter icon.
The image viewer also allows you to view an image in detail and compare with a different image. Zoom into the picture using the mouse wheel or the fingers on the smartphone and select another picture from the list. The selected image section remains the same and changes can be easily identified. Switch between images using the arrows (up and down) or tap them with the mouse. You want to compare specific images? No problem, mark them by holding down the Ctrl key and switch back and forth between the images with the arrow keys. Often it is useful to compare images with a similar exposure. To do so, select a suitable duration in the filter, as shown in the example below.

Available camera images and videos are displayed next to the map or on the mobile phone below (scroll down). Important event parameters such as start time, duration, size and front speed are displayed above. Click the arrows to view the event images or start the video where available.
Control center
The control center is used for manual remote actions and it provides an overview of the current system status. Authorized users can close roads, reset alarms or trigger other actions (for example, override an automatic action). The screenshot below shows the system status of an avalanche radar system in Norway with two radar heads and integration into the road authority’s traffic control system.

Applied technologies
GRAVX online data portal is an integrated part of all our monitoring systems. All our stations are connected to the internet and send their data to our servers. Likewise, GEOPREVENT have access to all systems to monitor them permanently.
Learn more about some of the technologies used:
Demo account
Would you like to try out GRAVX online data portal? Please contact us at info@geoprevent.com for a demo access.